Skip to content
Rare Builders

Orlando, Florida / Neighborhood report

Orwin Manor

New-construction sales and practical planning for your next home.

Report updated

Source prepared

Planned refresh · Friday mornings

The buyer's brief

Orwin Manor had no MLS-listed new-construction closings in the completed October 2025-September 2026 period, so this sales group offers no recent finished-new-home comparison. If an existing home interests you, decide what you would keep and what would have to change before choosing between renovation and a new build. Bring the survey, existing plans and your must-have spaces to the first planning conversation. Ten single-family homes are active as of October 30.

MLS Listed New Construction

Closed sales · Past 12 months

October 1, 2025–September 30, 2026

0

Homes sold

No MLS-listed new-construction closings in this period.

Comparisons, sale details & methodology

New construction means the MLS New Construction YN flag is Yes. These sales are included in all-home totals, not an additional group. Medians with fewer than five eligible sales are suppressed.

September 2026 · 0 closed sales

Monthly median: Unavailablen = 0 · missing 0 · coverage unavailable

Month over month: Unavailable

Comparison: August 2026 · Unavailablen = 0 · missing 0 · coverage unavailable

Year over year: Unavailable

Comparison: September 2025 · Unavailablen = 0 · missing 0 · coverage unavailable

Trailing 12 complete months · October 1, 2025–September 30, 2026 · 0 closed sales

Median sold price: Unavailablen = 0 · missing 0 · coverage unavailable

Prior 12 complete months · October 1, 2024–September 30, 2025 · 1 sales

Prior median: Suppressedn = 1 · missing 0 · coverage 100% · Fewer than 5

Trailing-year median change: Unavailable

MLS Listed New Construction — sale details

October 1, 2025–September 30, 2026 · 0 sales in this group

No closed sales

Price coverage: 0 valid · 0 missing · unavailable

This describes an actual highest closed transaction, not a typical price or a market trend.

Completed-month figures and sample sizes · MLS Listed New Construction
MonthClosed sales / sample nMedian sold priceMedian $ / heated sq ftMedian ADOMMedian CDOM
October 20250 / 0Unavailablen = 0 · missing 0 · coverage unavailableUnavailablen = 0 · missing 0 · coverage unavailableUnavailablen = 0 · missing 0 · coverage unavailableUnavailablen = 0 · missing 0 · coverage unavailable
November 20250 / 0Unavailablen = 0 · missing 0 · coverage unavailableUnavailablen = 0 · missing 0 · coverage unavailableUnavailablen = 0 · missing 0 · coverage unavailableUnavailablen = 0 · missing 0 · coverage unavailable
December 20250 / 0Unavailablen = 0 · missing 0 · coverage unavailableUnavailablen = 0 · missing 0 · coverage unavailableUnavailablen = 0 · missing 0 · coverage unavailableUnavailablen = 0 · missing 0 · coverage unavailable
January 20260 / 0Unavailablen = 0 · missing 0 · coverage unavailableUnavailablen = 0 · missing 0 · coverage unavailableUnavailablen = 0 · missing 0 · coverage unavailableUnavailablen = 0 · missing 0 · coverage unavailable
February 20260 / 0Unavailablen = 0 · missing 0 · coverage unavailableUnavailablen = 0 · missing 0 · coverage unavailableUnavailablen = 0 · missing 0 · coverage unavailableUnavailablen = 0 · missing 0 · coverage unavailable
March 20260 / 0Unavailablen = 0 · missing 0 · coverage unavailableUnavailablen = 0 · missing 0 · coverage unavailableUnavailablen = 0 · missing 0 · coverage unavailableUnavailablen = 0 · missing 0 · coverage unavailable
April 20260 / 0Unavailablen = 0 · missing 0 · coverage unavailableUnavailablen = 0 · missing 0 · coverage unavailableUnavailablen = 0 · missing 0 · coverage unavailableUnavailablen = 0 · missing 0 · coverage unavailable
May 20260 / 0Unavailablen = 0 · missing 0 · coverage unavailableUnavailablen = 0 · missing 0 · coverage unavailableUnavailablen = 0 · missing 0 · coverage unavailableUnavailablen = 0 · missing 0 · coverage unavailable
June 20260 / 0Unavailablen = 0 · missing 0 · coverage unavailableUnavailablen = 0 · missing 0 · coverage unavailableUnavailablen = 0 · missing 0 · coverage unavailableUnavailablen = 0 · missing 0 · coverage unavailable
July 20260 / 0Unavailablen = 0 · missing 0 · coverage unavailableUnavailablen = 0 · missing 0 · coverage unavailableUnavailablen = 0 · missing 0 · coverage unavailableUnavailablen = 0 · missing 0 · coverage unavailable
August 20260 / 0Unavailablen = 0 · missing 0 · coverage unavailableUnavailablen = 0 · missing 0 · coverage unavailableUnavailablen = 0 · missing 0 · coverage unavailableUnavailablen = 0 · missing 0 · coverage unavailable
September 20260 / 0Unavailablen = 0 · missing 0 · coverage unavailableUnavailablen = 0 · missing 0 · coverage unavailableUnavailablen = 0 · missing 0 · coverage unavailableUnavailablen = 0 · missing 0 · coverage unavailable

What this means if you are planning to build

An older house deserves a scope review before you treat it as a teardown. List the layout changes, garage needs and outdoor spaces you want, then have the existing conditions assessed. Our 100 E Rockwood project in Winter Park involved extensive restoration, including rebuilding the garage and renewing the interiors. It is an example of a restoration scope, not evidence that the same approach will suit an Orwin Manor property.

Explore the 100 E Rockwood restoration

Explore building in Orwin Manor and nearby neighborhoods

The area behind the numbers

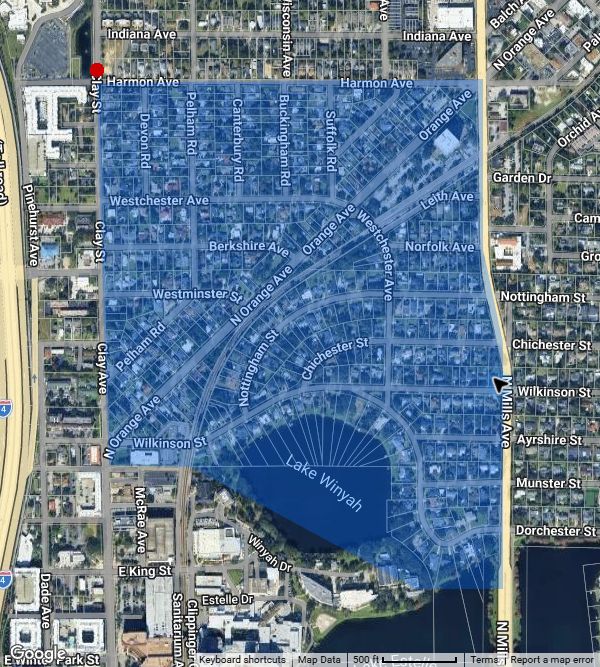
Single-family homes within the saved reporting area. This is a locally defined reporting area, not a legal boundary.

The blue shaded Orwin Manor reporting area extends from Harmon Avenue toward Lake Winyah, between Clay Avenue and North Mills Avenue. The saved outline defines the sample.

View full-size map to read its labels and attribution.

The blue shaded Orwin Manor reporting area extends from Harmon Avenue toward Lake Winyah, between Clay Avenue and North Mills Avenue. The saved outline defines the sample.

Original saved MLS / Matrix map screenshot. Google and map-data attribution, scale and source footer are retained in the image.

Map captured .

Illustration from the original saved MLS map. Statistics use the original saved polygons; this screenshot is not machine-readable boundary geometry.

Median sold price

Too few sales for a monthly median

September 2026 · complete calendar month

1 closed sales · all single-family homes

Comparison not available

Month over month

September 2026 vs. August 2026

Suppressed · 3 sales

Comparison not available

Year over year

September 2026 vs. September 2025

Unavailable · 0 sales

Monthly sales history and data coveragen = 1 · missing 0 · coverage 100% · Fewer than 5

Sample rule: 0 unavailable; 1–4 suppressed; 5–9 limited sample; 10 or more headline. Unavailable comparisons include suppressed or zero-denominator baselines.

Monthly medians are unavailable or suppressed because samples are below five. Counts and coverage remain in the table.

Completed-month figures and sample sizes · all single-family homes
MonthClosed sales / sample nMedian sold priceMedian $ / heated sq ftMedian ADOMMedian CDOM
October 20251 / 1Suppressedn = 1 · missing 0 · coverage 100% · Fewer than 5Suppressedn = 1 · missing 0 · coverage 100% · Fewer than 5Suppressedn = 1 · missing 0 · coverage 100% · Fewer than 5Suppressedn = 1 · missing 0 · coverage 100% · Fewer than 5
November 20251 / 1Suppressedn = 1 · missing 0 · coverage 100% · Fewer than 5Suppressedn = 1 · missing 0 · coverage 100% · Fewer than 5Suppressedn = 1 · missing 0 · coverage 100% · Fewer than 5Suppressedn = 1 · missing 0 · coverage 100% · Fewer than 5
December 20251 / 1Suppressedn = 1 · missing 0 · coverage 100% · Fewer than 5Suppressedn = 1 · missing 0 · coverage 100% · Fewer than 5Suppressedn = 1 · missing 0 · coverage 100% · Fewer than 5Suppressedn = 1 · missing 0 · coverage 100% · Fewer than 5
January 20260 / 0Unavailablen = 0 · missing 0 · coverage unavailableUnavailablen = 0 · missing 0 · coverage unavailableUnavailablen = 0 · missing 0 · coverage unavailableUnavailablen = 0 · missing 0 · coverage unavailable
February 20261 / 1Suppressedn = 1 · missing 0 · coverage 100% · Fewer than 5Suppressedn = 1 · missing 0 · coverage 100% · Fewer than 5Suppressedn = 1 · missing 0 · coverage 100% · Fewer than 5Suppressedn = 1 · missing 0 · coverage 100% · Fewer than 5
March 20264 / 4Suppressedn = 4 · missing 0 · coverage 100% · Fewer than 5Suppressedn = 4 · missing 0 · coverage 100% · Fewer than 5Suppressedn = 4 · missing 0 · coverage 100% · Fewer than 5Suppressedn = 4 · missing 0 · coverage 100% · Fewer than 5
April 20260 / 0Unavailablen = 0 · missing 0 · coverage unavailableUnavailablen = 0 · missing 0 · coverage unavailableUnavailablen = 0 · missing 0 · coverage unavailableUnavailablen = 0 · missing 0 · coverage unavailable
May 20261 / 1Suppressedn = 1 · missing 0 · coverage 100% · Fewer than 5Suppressedn = 1 · missing 0 · coverage 100% · Fewer than 5Suppressedn = 1 · missing 0 · coverage 100% · Fewer than 5Suppressedn = 1 · missing 0 · coverage 100% · Fewer than 5
June 20262 / 2Suppressedn = 2 · missing 0 · coverage 100% · Fewer than 5Suppressedn = 2 · missing 0 · coverage 100% · Fewer than 5Suppressedn = 2 · missing 0 · coverage 100% · Fewer than 5Suppressedn = 2 · missing 0 · coverage 100% · Fewer than 5
July 20260 / 0Unavailablen = 0 · missing 0 · coverage unavailableUnavailablen = 0 · missing 0 · coverage unavailableUnavailablen = 0 · missing 0 · coverage unavailableUnavailablen = 0 · missing 0 · coverage unavailable
August 20263 / 3Suppressedn = 3 · missing 0 · coverage 100% · Fewer than 5Suppressedn = 3 · missing 0 · coverage 100% · Fewer than 5Suppressedn = 3 · missing 0 · coverage 100% · Fewer than 5Suppressedn = 3 · missing 0 · coverage 100% · Fewer than 5
September 20261 / 1Suppressedn = 1 · missing 0 · coverage 100% · Fewer than 5Suppressedn = 1 · missing 0 · coverage 100% · Fewer than 5Suppressedn = 1 · missing 0 · coverage 100% · Fewer than 5Suppressedn = 1 · missing 0 · coverage 100% · Fewer than 5

Latest inventory snapshot

As of · all single-family homes

10

Active homes

1 pending homes, reported separately.

70%

Currently below original asking price

Data coverage

0 missing · coverage 100%

7 of 10 eligible active listings. This comparison does not identify every listing with a historical price cut.

Compare inventory snapshots

Inventory snapshot comparison

October 23, 2026 to October 30, 2026: active homes changed from 9 to 10; pending homes remained at 1.

These are differences between two inventory snapshots, not counts of homes sold or evidence that particular listings changed status. September monthly sales comparisons are reported separately.

Price-reduction timing data

Unavailable. Complete dated price-reduction history has not been verified.

Highest closed transactions and trailing-year figures

Highest closed transactions

Latest 12 complete months. Factual transaction maxima are shown even when a group's trend metrics are suppressed. No owner or contact details are included.

All single-family homes

October 1, 2025–September 30, 2026 · 15 sales in this group

$2,300,000

Price coverage: 15 valid · 0 missing · 100%

Closed · 3,750 heated sq ft · $613 per heated sq ft

This describes an actual highest closed transaction, not a typical price or a market trend.

Trailing 12 complete months · October 1, 2025–September 30, 2026 · 15 closed sales

Median sold price: $675,000n = 15 · missing 0 · coverage 100%

Dated market notes and previous updates

The weekly perspective

What the figures show

Commentary edited October 30, 2026 for clearer buyer guidance. Original reporting dates and historical figures are retained; planning advice is editorial guidance, not a record of new research on those dates.

Define what needs to change

Ten single-family homes were active in Orwin Manor on October 30, with one pending. September's single closing still did not support a monthly median.

Before you buy, separate cosmetic changes from layout, structural and site work. Bring those priorities to the planning meeting so the discussion can address the actual property and the choice between renovation and a new build.

October 23, 2026 · Assess the property before choosing a path

Nine single-family homes were active in Orwin Manor on October 23. The completed October 2025-September 2026 period had no MLS-listed new-construction closings.

For a purchase tied to a building plan, start with the survey, existing conditions and the spaces you need. A property-specific scope review is more useful here than trying to extract a new-home budget from a sales cohort with no closings.

October 16, 2026 · Start with the house you would keep

Orwin Manor had 10 active single-family homes on October 16. September recorded one closing, too few to establish a useful monthly median.

For an existing home, list the rooms and features that work before deciding what needs to change. Have the structure and site reviewed before treating renovation or replacement as the obvious answer.

Earlier commentary remains dated below each new update. Compare the dated inventory snapshots above separately from completed-month sales figures.

Sources, sample rules and methodology

Methodology & data status

Source: Stellar MLS / Matrix aggregate export. Sold-price figures use completed calendar months; inventory uses its stated snapshot date. Partial October sales are excluded from completed-month comparisons and the line chart. Median price per heated square foot is the median of individual sale ratios. ADOM and CDOM are reported separately as supplied by MLS. Sample counts accompany each monthly figure.

These figures describe five saved reporting areas, which can differ from commonly used neighborhood boundaries. Original map screenshots retain the source attribution. Factual highest transactions are distinct from suppressed trend metrics. Inventory comparisons describe differences between the stated snapshot dates; they do not identify individual listing transitions or the number of sales between those dates.