Skip to content
Rare Builders

Orlando, Florida / Neighborhood report

South Winter Park

A clearer view of the market, one neighborhood at a time.

Report updated

Source prepared

Planned refresh · Friday mornings

The area behind the numbers

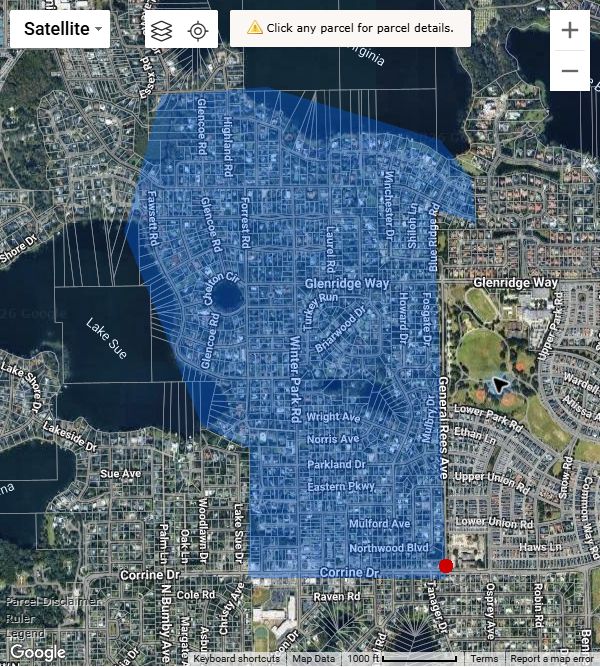
Single-family homes within the saved reporting area. This is a locally defined reporting area, not a legal boundary.

The blue shaded South Winter Park reporting area lies east of Lake Sue, west of General Rees Avenue and north of Corrine Drive, extending toward Lake Virginia. The saved outline defines the sample.

Open original map at full size. On smaller screens, swipe the map to read its labels and attribution.

The blue shaded South Winter Park reporting area lies east of Lake Sue, west of General Rees Avenue and north of Corrine Drive, extending toward Lake Virginia. The saved outline defines the sample.

Original saved MLS / Matrix map screenshot. Google and map-data attribution, scale and source footer are retained in the image.

Map captured .

Illustration from the original saved MLS map. Statistics use the original saved polygons; this screenshot is not machine-readable boundary geometry.

Median sold price

Suppressed

September 2026 · complete calendar month

3 closed sales · n = 3 · all single-family homes

Unavailable

Month over month

September 2026 vs. August 2026

$1,115,000 · 7 salesn = 7 · missing 0 · coverage 100% · Limited sample

Unavailable

Year over year

September 2026 vs. September 2025

Suppressed · 3 salesn = 3 · missing 0 · coverage 100% · Fewer than 5

n = 3 · missing 0 · coverage 100% · Fewer than 5

Sample rule: 0 unavailable; 1–4 suppressed; 5–9 limited sample; 10 or more headline. Unavailable comparisons include suppressed or zero-denominator baselines.

The past 12 completed months

Monthly median sold price · USD · October 2025–September 2026

Monthly median sold priceOne point per completed calendar month. All figures and sample counts are in the visible table below.$1050k$1600k$2150kOct 25Dec 25Feb 26Apr 26Jun 26Aug 26Sep 26

Changes in the mix of homes sold can move the median. This is not a measure of individual property appreciation.

Completed-month figures and sample sizes · all single-family homes
MonthClosed sales / sample nMedian sold priceMedian $ / heated sq ftMedian ADOMMedian CDOM
October 20256 / 6$1,418,100n = 6 · missing 0 · coverage 100% · Limited sample$525n = 6 · missing 0 · coverage 100% · Limited sample53.5n = 6 · missing 0 · coverage 100% · Limited sample53.5n = 6 · missing 0 · coverage 100% · Limited sample
November 20253 / 3Suppressedn = 3 · missing 0 · coverage 100% · Fewer than 5Suppressedn = 3 · missing 0 · coverage 100% · Fewer than 5Suppressedn = 3 · missing 0 · coverage 100% · Fewer than 5Suppressedn = 3 · missing 0 · coverage 100% · Fewer than 5
December 20257 / 7$1,050,000n = 7 · missing 0 · coverage 100% · Limited sample$571n = 7 · missing 0 · coverage 100% · Limited sample18n = 7 · missing 0 · coverage 100% · Limited sample18n = 7 · missing 0 · coverage 100% · Limited sample
January 20260 / 0Unavailablen = 0 · missing 0 · coverage unavailableUnavailablen = 0 · missing 0 · coverage unavailableUnavailablen = 0 · missing 0 · coverage unavailableUnavailablen = 0 · missing 0 · coverage unavailable
February 20264 / 4Suppressedn = 4 · missing 0 · coverage 100% · Fewer than 5Suppressedn = 4 · missing 0 · coverage 100% · Fewer than 5Suppressedn = 4 · missing 0 · coverage 100% · Fewer than 5Suppressedn = 4 · missing 0 · coverage 100% · Fewer than 5
March 20262 / 2Suppressedn = 2 · missing 0 · coverage 100% · Fewer than 5Suppressedn = 2 · missing 0 · coverage 100% · Fewer than 5Suppressedn = 2 · missing 0 · coverage 100% · Fewer than 5Suppressedn = 2 · missing 0 · coverage 100% · Fewer than 5
April 20260 / 0Unavailablen = 0 · missing 0 · coverage unavailableUnavailablen = 0 · missing 0 · coverage unavailableUnavailablen = 0 · missing 0 · coverage unavailableUnavailablen = 0 · missing 0 · coverage unavailable
May 20263 / 3Suppressedn = 3 · missing 0 · coverage 100% · Fewer than 5Suppressedn = 3 · missing 0 · coverage 100% · Fewer than 5Suppressedn = 3 · missing 0 · coverage 100% · Fewer than 5Suppressedn = 3 · missing 0 · coverage 100% · Fewer than 5
June 202610 / 10$1,375,000n = 10 · missing 0 · coverage 100%$483n = 10 · missing 0 · coverage 100%14n = 10 · missing 0 · coverage 100%14n = 10 · missing 0 · coverage 100%
July 20265 / 5$2,150,000n = 5 · missing 0 · coverage 100% · Limited sample$591n = 5 · missing 0 · coverage 100% · Limited sample35n = 5 · missing 0 · coverage 100% · Limited sample35n = 5 · missing 0 · coverage 100% · Limited sample
August 20267 / 7$1,115,000n = 7 · missing 0 · coverage 100% · Limited sample$503n = 7 · missing 0 · coverage 100% · Limited sample73n = 7 · missing 0 · coverage 100% · Limited sample73n = 7 · missing 0 · coverage 100% · Limited sample
September 20263 / 3Suppressedn = 3 · missing 0 · coverage 100% · Fewer than 5Suppressedn = 3 · missing 0 · coverage 100% · Fewer than 5Suppressedn = 3 · missing 0 · coverage 100% · Fewer than 5Suppressedn = 3 · missing 0 · coverage 100% · Fewer than 5

Latest inventory snapshot

As of · all single-family homes

19

Active homes

5 pending homes, reported separately.

36.8%

Currently below original asking price

0 missing · coverage 100%

7 of 19 eligible active listings. This comparison does not identify every listing with a historical price cut.

Median days to first price reduction

Unavailable. Complete dated price-reduction history has not been verified.

MLS Listed New Construction

Closed sales · Past 12 months

October 1, 2025–September 30, 2026

6

Homes sold

$3,296,750

Median sale price

Limited sample

$3,675,000

Highest closed sale

Highest sale is an actual transaction, not a typical price.

Comparisons, sale details & methodology

New construction means the MLS New Construction YN flag is Yes. These sales are included in all-home totals, not an additional group. Medians with fewer than five eligible sales are suppressed.

September 2026 · 0 closed sales

Monthly median: Unavailablen = 0 · missing 0 · coverage unavailable

Month over month: Unavailable

Comparison: August 2026 · Suppressedn = 2 · missing 0 · coverage 100% · Fewer than 5

Year over year: Unavailable

Comparison: September 2025 · Unavailablen = 0 · missing 0 · coverage unavailable

Trailing 12 complete months · October 1, 2025–September 30, 2026 · 6 closed sales

Median sold price: $3,296,750n = 6 · missing 0 · coverage 100% · Limited sample

Prior 12 complete months · October 1, 2024–September 30, 2025 · 7 sales

Prior median: $2,300,000n = 7 · missing 0 · coverage 100% · Limited sample

Trailing-year median change: +43.3%

MLS Listed New Construction — sale details

October 1, 2025–September 30, 2026 · 6 sales in this group

$3,675,000

Price coverage: 6 valid · 0 missing · 100%

Closed · 4,451 heated sq ft · $826 per heated sq ft

This describes an actual highest closed transaction, not a typical price or a market trend.

Completed-month figures and sample sizes · MLS Listed New Construction
MonthClosed sales / sample nMedian sold priceMedian $ / heated sq ftMedian ADOMMedian CDOM
October 20250 / 0Unavailablen = 0 · missing 0 · coverage unavailableUnavailablen = 0 · missing 0 · coverage unavailableUnavailablen = 0 · missing 0 · coverage unavailableUnavailablen = 0 · missing 0 · coverage unavailable
November 20250 / 0Unavailablen = 0 · missing 0 · coverage unavailableUnavailablen = 0 · missing 0 · coverage unavailableUnavailablen = 0 · missing 0 · coverage unavailableUnavailablen = 0 · missing 0 · coverage unavailable
December 20250 / 0Unavailablen = 0 · missing 0 · coverage unavailableUnavailablen = 0 · missing 0 · coverage unavailableUnavailablen = 0 · missing 0 · coverage unavailableUnavailablen = 0 · missing 0 · coverage unavailable
January 20260 / 0Unavailablen = 0 · missing 0 · coverage unavailableUnavailablen = 0 · missing 0 · coverage unavailableUnavailablen = 0 · missing 0 · coverage unavailableUnavailablen = 0 · missing 0 · coverage unavailable
February 20261 / 1Suppressedn = 1 · missing 0 · coverage 100% · Fewer than 5Suppressedn = 1 · missing 0 · coverage 100% · Fewer than 5Suppressedn = 1 · missing 0 · coverage 100% · Fewer than 5Suppressedn = 1 · missing 0 · coverage 100% · Fewer than 5
March 20260 / 0Unavailablen = 0 · missing 0 · coverage unavailableUnavailablen = 0 · missing 0 · coverage unavailableUnavailablen = 0 · missing 0 · coverage unavailableUnavailablen = 0 · missing 0 · coverage unavailable
April 20260 / 0Unavailablen = 0 · missing 0 · coverage unavailableUnavailablen = 0 · missing 0 · coverage unavailableUnavailablen = 0 · missing 0 · coverage unavailableUnavailablen = 0 · missing 0 · coverage unavailable
May 20261 / 1Suppressedn = 1 · missing 0 · coverage 100% · Fewer than 5Suppressedn = 1 · missing 0 · coverage 100% · Fewer than 5Suppressedn = 1 · missing 0 · coverage 100% · Fewer than 5Suppressedn = 1 · missing 0 · coverage 100% · Fewer than 5
June 20261 / 1Suppressedn = 1 · missing 0 · coverage 100% · Fewer than 5Suppressedn = 1 · missing 0 · coverage 100% · Fewer than 5Suppressedn = 1 · missing 0 · coverage 100% · Fewer than 5Suppressedn = 1 · missing 0 · coverage 100% · Fewer than 5
July 20261 / 1Suppressedn = 1 · missing 0 · coverage 100% · Fewer than 5Suppressedn = 1 · missing 0 · coverage 100% · Fewer than 5Suppressedn = 1 · missing 0 · coverage 100% · Fewer than 5Suppressedn = 1 · missing 0 · coverage 100% · Fewer than 5
August 20262 / 2Suppressedn = 2 · missing 0 · coverage 100% · Fewer than 5Suppressedn = 2 · missing 0 · coverage 100% · Fewer than 5Suppressedn = 2 · missing 0 · coverage 100% · Fewer than 5Suppressedn = 2 · missing 0 · coverage 100% · Fewer than 5
September 20260 / 0Unavailablen = 0 · missing 0 · coverage unavailableUnavailablen = 0 · missing 0 · coverage unavailableUnavailablen = 0 · missing 0 · coverage unavailableUnavailablen = 0 · missing 0 · coverage unavailable

Highest closed transactions

Latest 12 complete months. Factual transaction maxima are shown even when a group's trend metrics are suppressed. No owner or contact details are included.

All single-family homes

October 1, 2025–September 30, 2026 · 50 sales in this group

$4,450,000

Price coverage: 50 valid · 0 missing · 100%

Closed · 5,160 heated sq ft · $862 per heated sq ft

This describes an actual highest closed transaction, not a typical price or a market trend.

Trailing 12 complete months · October 1, 2025–September 30, 2026 · 50 closed sales

Median sold price: $1,097,500n = 50 · missing 0 · coverage 100%

What this means if you are planning to build

South Winter Park recorded six MLS-listed new-construction sales from October 1, 2025 through September 30, 2026. The median offers limited-sample context for finished homes, but six sales can reflect very different properties. It cannot tell you what your home will cost to build. Compare the homes behind any benchmark with your intended size and specifications, and price your proposed work separately. MLS-flagged sales do not represent every custom build.

Explore custom home building in Winter Park

The weekly perspective

What the figures show

The first verified snapshot

September recorded 3 closed single-family home sales. Monthly prices and time-on-market figures are suppressed because the sample is below five. Trailing 12-month figures provide broader context where the sample permits.

The October 16 snapshot contains 19 active and 5 pending homes. 7 of 19 eligible active listings currently ask below their original price. No prior weekly snapshot is available, so a week-over-week inventory change is not reported.

Earlier commentary remains dated below each new update. No earlier weekly comparison is available yet.

Methodology & data status

Source: Stellar MLS / Matrix aggregate export. Sold-price figures use completed calendar months; inventory uses its stated snapshot date. Partial October sales are excluded from completed-month comparisons and the line chart. Median price per heated square foot is the median of individual sale ratios. ADOM and CDOM are reported separately as supplied by MLS. Sample counts accompany each monthly figure.

These figures describe five saved reporting areas, which can differ from commonly used neighborhood boundaries. Original map screenshots retain the source attribution. Factual highest transactions are distinct from suppressed trend metrics. The first inventory snapshot establishes a baseline; no week-over-week change is inferred.